
Mathematics, 30.06.2019 06:50 alkinoonn
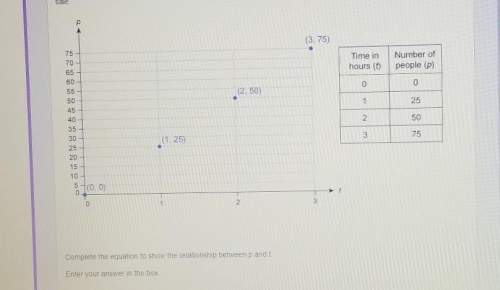
The plot and table show the number of people, p, who have bought tickets to a concert ,t, minutes after they went on sale. complete the equation to show the relationship between p and t

Answers: 1


Other questions on the subject: Mathematics
Mathematics, 22.06.2019 02:00, UncleVictor5188
Alexandra drove from michigan to colorado to visit her friend. the speed limit on the highway is 70 miles per hour. if alexandra's combined driving time for the trip was 14 hours how many miles did alejandra drive?
Answers: 1
Mathematics, 22.06.2019 02:40, lorenialopez1234
The graph shows a vertical translation of y= square root of x cubedwhat is the range of the translated function? {yly < 0}{yly > 0}{yly is a natural number}{yly is a real number}
Answers: 3
Mathematics, 22.06.2019 03:30, Salamonti
The diameter of a bacteria colony that doubles every hour is represented by the graph below. what is the diameter of the bacteria after 8 hours? graph of a curve passing through the points zero comma 1, one comma two, two comma four, and three comma eight
Answers: 1
You know the right answer?
The plot and table show the number of people, p, who have bought tickets to a concert ,t, minutes af...
Questions in other subjects:


Mathematics, 27.09.2020 21:01
Mathematics, 27.09.2020 21:01

Social Studies, 27.09.2020 21:01

History, 27.09.2020 21:01
English, 27.09.2020 21:01
Mathematics, 27.09.2020 21:01


