
Mathematics, 23.10.2019 04:00 kadenbaker4347
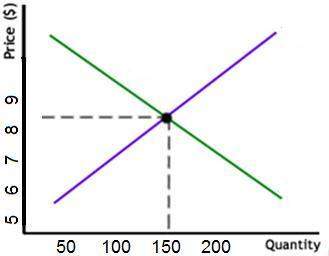
This graph shows the supply and demand relationships for a toy. quantities are per week. to the nearest dollar, what is the approximate price per item, when 100 items are supplied per week?

Answers: 2


Other questions on the subject: Mathematics
Mathematics, 21.06.2019 14:00, coltonduggan
Aright triangle has an area of 18 square inches. b: if the triangle is not an isosceles triangle, what are all the possible lengths of the legs, if the lengths are whole numbers. answer !
Answers: 1
Mathematics, 21.06.2019 15:00, brooklynmikestovgphx
What are the possible rational zeros of [tex]f(x) = x^4+2x^3-3x^2-4x+18[/tex]
Answers: 2
Mathematics, 21.06.2019 22:40, michaellagann2020
Adeli owner keeps track of the to-go orders each day. the results from last saturday are shown in the given two-way frequency table. saturday's to-go deli orders in person by phone online total pick up 38 25 31 94 delivery 35 28 34 97 total 73 53 65 191 what percent of the to-go orders were delivery orders placed by phone? a. 14.66% b. 38.41% c. 28.87% d. 52.83%
Answers: 2
You know the right answer?
This graph shows the supply and demand relationships for a toy. quantities are per week. to the near...
Questions in other subjects:

English, 14.01.2021 01:00
Mathematics, 14.01.2021 01:00


Mathematics, 14.01.2021 01:00
Mathematics, 14.01.2021 01:00


