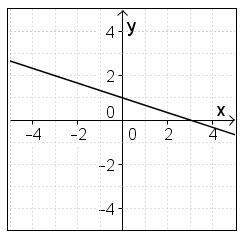
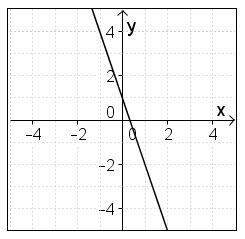
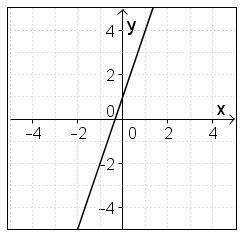
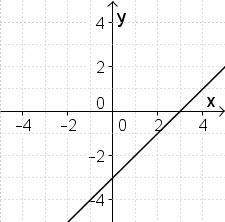
Which graph represents the linear function y = –3x + 1?
...

Mathematics, 23.11.2019 23:31 lollollollollol1
Which graph represents the linear function y = –3x + 1?

Answers: 3


Other questions on the subject: Mathematics
Mathematics, 21.06.2019 14:00, johnnysteeler9934
Bruce is getting materials for a chemistry experiment his teacher gives him a container that has 0.25 liter of liquid in it. bruce need to use 0.4 of this liquid for the experiment. how much liquid will bruce use?
Answers: 3
Mathematics, 21.06.2019 20:30, yfgkeyonna
On a cm grid, point p has coordinates (3,-1) and point q has coordinates (-5,6) calculate the shortest distance between p and q give your answer to 1 decimal place
Answers: 2
Mathematics, 21.06.2019 20:30, chicalapingpon1938
Janet is rolling a number cube with the numbers one through six she record the numbers after each row if she rolls of keep 48 times how many times should she expect to roll a 4
Answers: 1
You know the right answer?
Questions in other subjects:
Mathematics, 11.10.2020 21:01
Mathematics, 11.10.2020 21:01

English, 11.10.2020 21:01

Biology, 11.10.2020 21:01

Biology, 11.10.2020 21:01


