
Mathematics, 12.11.2019 11:31 jasmine8142002
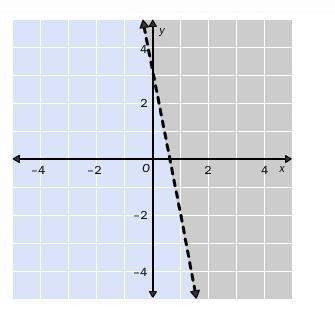
Choose the linear inequality that describes the graph. the gray area represents the shaded region.
y > –5x – 3
y > –5x + 3
y > –3x + 5
y < –5x + 3

Answers: 3


Other questions on the subject: Mathematics
Mathematics, 21.06.2019 16:30, sydthekid9044
Divide the following fractions 3/4 ÷ 2/3 1/2 8/9 9/8 2
Answers: 2
Mathematics, 21.06.2019 18:30, bellabarfield4286
The u-drive rent-a-truck company plans to spend $13 million on 320 new vehicles. each commercial van will cost $25 comma 000, each small truck $50 comma 000, and each large truck $80 comma 000. past experience shows that they need twice as many vans as small trucks. how many of each type of vehicle can they buy?
Answers: 1
Mathematics, 21.06.2019 20:00, naimareiad
Ialready asked this but i never got an answer. will give a high rating and perhaps brainliest. choose the linear inequality that describes the graph. the gray area represents the shaded region. y ≤ –4x – 2 y > –4x – 2 y ≥ –4x – 2 y < 4x – 2
Answers: 1
You know the right answer?
Choose the linear inequality that describes the graph. the gray area represents the shaded region.
Questions in other subjects:


Social Studies, 22.07.2019 12:00

English, 22.07.2019 12:00
Mathematics, 22.07.2019 12:00


