
Mathematics, 29.11.2019 01:31 pakabigail4796
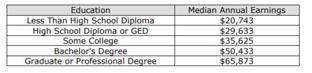
The table shows the effect of education on annual income. based on the data in the table, how much more does a person with an bachelor’s degree earn than a person with only a high school diploma over 10 years?
a) $20,800
b) $29,690
c) $208,000
d)$290,690

Answers: 2


Other questions on the subject: Mathematics
Mathematics, 21.06.2019 12:30, Tayannamorgan2373
Mercury poisoning is dangerous overload of mercury within the body. a major source of mercury within the body, a major source of mercury poisoning is consuming fish that contain mercury. certain fish are more prone to having higher levels of mercury than others. the pie chart shows the distribution of four breeds of fish at a hatchery. the hatchery has approximately 6,000 fish. a biologist from the centers for disease control and prevention randomly test 5% of each breed of fish for mercury content. her findings are shown in the following table. based on the biologist's findings, if a single salmon is randomly selected from those that were tested, what is the probability that this particular fish would have a dangerous mercury level? a) 0.001 b) 0.004 c) 0.02 d) 0.08
Answers: 1
Mathematics, 21.06.2019 20:30, cogger9348
3.17 scores on stats final. below are final exam scores of 20 introductory statistics students. 1 2 3 4 5 6 7 8 9 10 11 12 13 14 15 16 17 18 19 20 57, 66, 69, 71, 72, 73, 74, 77, 78, 78, 79, 79, 81, 81, 82, 83, 83, 88, 89, 94 (a) the mean score is 77.7 points. with a standard deviation of 8.44 points. use this information to determine if the scores approximately follow the 68-95-99.7% rule. (b) do these data appear to follow a normal distribution? explain your reasoning using the graphs provided below.
Answers: 1
Mathematics, 21.06.2019 21:00, mscharris66
Simplify. 4+3/7x-2-2/7x a. 2-5/7x b. 6-1/7x c. 2+1/7x d. 6+5/7x
Answers: 1
Mathematics, 21.06.2019 22:00, rhineharttori
Here is my question! jayne is studying urban planning and finds that her town is decreasing in population by 3% each year. the population of her town is changing by a constant rate. true or false?
Answers: 2
You know the right answer?
The table shows the effect of education on annual income. based on the data in the table, how much m...
Questions in other subjects:

Mathematics, 18.12.2020 03:20


Arts, 18.12.2020 03:20
Mathematics, 18.12.2020 03:20


