The graph shows the number of paintballs a machine launches, y, in x seconds:
a graph t...

Mathematics, 19.11.2019 00:31 kyliefetters11
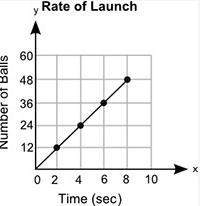
The graph shows the number of paintballs a machine launches, y, in x seconds:
a graph titled rate of launch is shown. the x axis label is time in seconds, and the x axis values are from 0 to 10 in increments of 2 for each grid line. the y axis label is number of balls, and the y axis values from 0 to 60 in increments of 12 for each grid line. a line is shown connecting points on ordered pair 2, 12 and 4, 24 and 6, 36 and 8, 48.
which expression can be used to calculate the rate per second at which the machine launches the balls?
a.) 2/12
b.) 12/2
c.) 2/48
d.) 48/2

Answers: 2


Other questions on the subject: Mathematics
Mathematics, 21.06.2019 23:30, saintsfan2004
Arestaurant added a new outdoor section that was 8 feet wide and 6 feet long. what is the area of their new outdoor section
Answers: 1
Mathematics, 22.06.2019 00:30, vannybelly83
Can someone me and explain..will award brainlest!
Answers: 2
You know the right answer?
Questions in other subjects:

Mathematics, 16.10.2020 03:01


History, 16.10.2020 03:01
Mathematics, 16.10.2020 03:01

English, 16.10.2020 03:01
Mathematics, 16.10.2020 03:01
History, 16.10.2020 03:01


