
Mathematics, 13.10.2019 17:30 coolasslimm
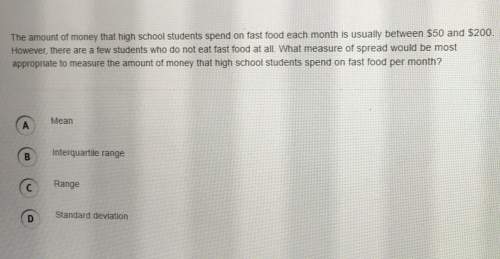
The amount of money that high school students spend on fast food each month is usually between $50 and $200.however, there are a few students who do not eat fast food at all. what measure of spread would be mostappropriate to measure the amount of money that high school students spend on fast food per month? a meaninterquartile rangerangestandard deviation

Answers: 2


Other questions on the subject: Mathematics
Mathematics, 21.06.2019 18:00, cashhd1212
The given dot plot represents the average daily temperatures, in degrees fahrenheit, recorded in a town during the first 15 days of september. if the dot plot is converted to a box plot, the first quartile would be drawn at __ , and the third quartile would be drawn at __ link to graph: .
Answers: 1
Mathematics, 21.06.2019 19:30, nmg9
The revenue each season from tickets at the theme park is represented by t(c)=5x. the cost to pay the employees each season is represented by r(x)=(1.5)^x. examine the graph of the combined function for total profit and estimate the profit after four seasons
Answers: 3
You know the right answer?
The amount of money that high school students spend on fast food each month is usually between $50 a...
Questions in other subjects:

Mathematics, 12.08.2020 05:01


Mathematics, 12.08.2020 05:01

English, 12.08.2020 05:01


