
Mathematics, 13.10.2019 22:30 lilswetheart2007
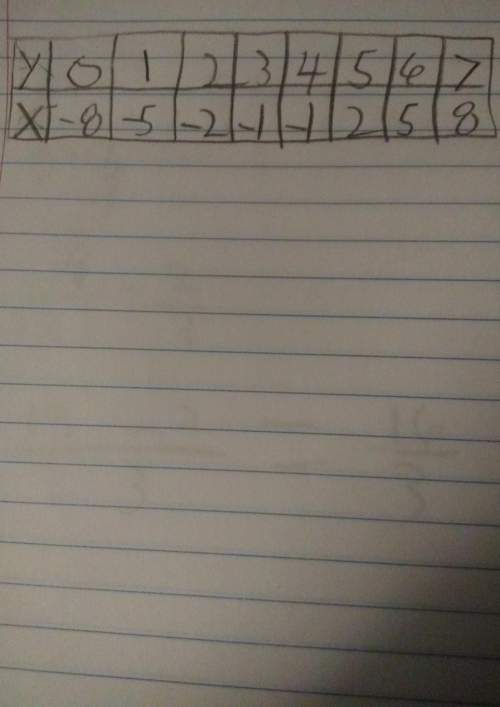
Use a graphing calculator to find an equation of the line of best fit for the data. identify and interpret the correlation coefficient.) i don't have a caculator btw

Answers: 2


Other questions on the subject: Mathematics
Mathematics, 21.06.2019 20:00, emilysambrano2
Which part of a 2-column proof is the hypothesis of the conjecture? a) given b) reasons c) prove d) statements ! i think it's b but i'm not quite
Answers: 3
Mathematics, 21.06.2019 20:00, oofoofoof1
Fred has a spinner that is split into four equal sections: red, blue, green, and yellow. fred spun the spinner 688 times. which of the following would be a good estimate of the number of times the spinner lands on the green section? a. 269 b. 603 c. 344 d. 189
Answers: 1
Mathematics, 21.06.2019 21:40, avahrider1
The graph of f(x) = |x| is transformed to g(x) = |x + 11| - 7. on which interval is the function decreasing?
Answers: 3
You know the right answer?
Use a graphing calculator to find an equation of the line of best fit for the data. identify and int...
Questions in other subjects:


English, 06.05.2020 04:15

History, 06.05.2020 04:15

Chemistry, 06.05.2020 04:16


