as x increases, y increases; r = 0.42

Mathematics, 31.01.2020 02:48 GreenHerbz206
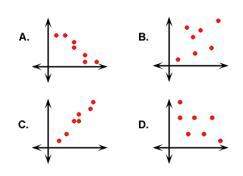
Which graph best represents the following situation?
as x increases, y increases; r = 0.42
graph a
graph b
graph c
graph d

Answers: 1


Other questions on the subject: Mathematics
Mathematics, 21.06.2019 21:00, hastephens03
Mr. thompson is on a diet. he currently weighs 260 pounds. he loses 4 pounds per month. what part of the story makes the relationship not proportional?
Answers: 3
Mathematics, 21.06.2019 22:00, jladinosolarsee
If tan2a=cot(a+60), find the value of a, where 2a is an acute angle
Answers: 1
Mathematics, 21.06.2019 22:30, emmanuelmashao5504
Given that y varies directly to the square root of (x + 1), and that y = 1 when x = 8,(a)express y in terms of .x,(b)find the value of y when x = 3,(c)find the value of x when y = 5.
Answers: 1
You know the right answer?
Which graph best represents the following situation?
as x increases, y increases; r = 0.42
as x increases, y increases; r = 0.42
Questions in other subjects:
SAT, 07.12.2021 02:50

Chemistry, 07.12.2021 02:50
Chemistry, 07.12.2021 02:50


SAT, 07.12.2021 02:50


