
Mathematics, 02.01.2020 22:31 jess7kids
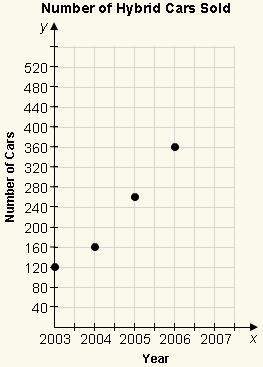
Use the graph to predict the number of hybrid cars sold at a local car dealership in 2007.
a. 520
b.320
c. 460
d.280

Answers: 1


Other questions on the subject: Mathematics
Mathematics, 21.06.2019 15:40, 1tallison1
What is the first quartile of this data set? 10, 11, 12, 15, 17, 19, 22, 24, 29, 33, 38 a. 12 b. 19 c. 29 d. 10
Answers: 1
You know the right answer?
Use the graph to predict the number of hybrid cars sold at a local car dealership in 2007.
Questions in other subjects:
Mathematics, 02.10.2019 17:20

Mathematics, 02.10.2019 17:20

History, 02.10.2019 17:20


