
Mathematics, 17.10.2019 08:00 cam1295
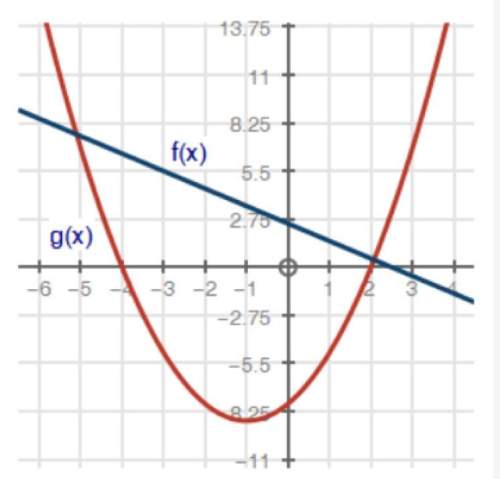
Based on the graph below, what is the solution to the equation f(x) = g(x)? x = −4 and x = 2 x = −4 and x = 2.5 x = −5.1 and x = 2.1 x = −5.1 and x = 1.5

Answers: 3


Other questions on the subject: Mathematics
Mathematics, 21.06.2019 18:00, xxaurorabluexx
Suppose you are going to graph the data in the table. minutes temperature (°c) 0 -2 1 1 2 3 3 4 4 5 5 -4 6 2 7 -3 what data should be represented on each axis, and what should the axis increments be? x-axis: minutes in increments of 1; y-axis: temperature in increments of 5 x-axis: temperature in increments of 5; y-axis: minutes in increments of 1 x-axis: minutes in increments of 1; y-axis: temperature in increments of 1 x-axis: temperature in increments of 1; y-axis: minutes in increments of 5
Answers: 2
Mathematics, 21.06.2019 19:30, KariSupreme
Which inequalities can be used to find the solution set of the following inequality? check all that apply. |2x – 5| (2x – 5) (2x + 5) –(2x – 5) –(2x + 5)
Answers: 1
You know the right answer?
Based on the graph below, what is the solution to the equation f(x) = g(x)? x = −4 and x = 2 x = −4...
Questions in other subjects:

History, 17.10.2021 14:00

English, 17.10.2021 14:00


