


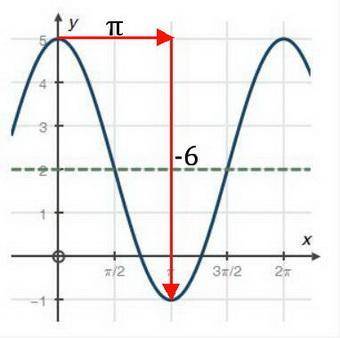
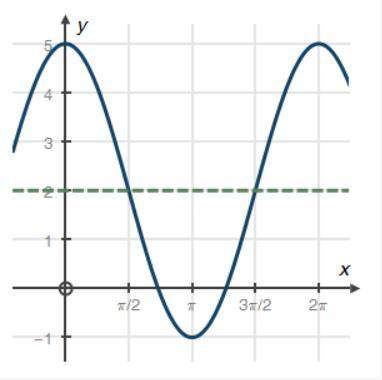
Use the graph below to answer the question that follows:
what is the rate of change bet...

Mathematics, 27.11.2019 06:31 djderokey7171
Use the graph below to answer the question that follows:
what is the rate of change between the interval x = 0 and x = π?
a. -pi/4
b. -4/pi
c. -pi/6
d. -6/pi

Answers: 3


Other questions on the subject: Mathematics
Mathematics, 21.06.2019 12:50, aspenbaxter201634
Simplify the expression. enter the correct answer.
Answers: 2
Mathematics, 21.06.2019 14:10, evalentine843
Olivia uses the work below to determine 55% of 720 which explains the error in olivia’s solution
Answers: 1
Mathematics, 21.06.2019 19:30, apere655
Ascientist wants to use a model to present the results of his detailed scientific investigation. why would a model be useful? a )because the model makes the concepts easier to understand b) because the model is easy to put together and to use c) because the model prevents other scientists from asking questions d) because the model requires the audience to pay full attention to it i don't know what to choose because between a and d a is much more likely than d because it only wants to get the attention of the audience. i'm confuse.
Answers: 1
You know the right answer?
Questions in other subjects:

Biology, 19.06.2021 08:30
Mathematics, 19.06.2021 08:30

Biology, 19.06.2021 08:30
Physics, 19.06.2021 08:30

Spanish, 19.06.2021 08:30

Social Studies, 19.06.2021 08:30
Biology, 19.06.2021 08:30


