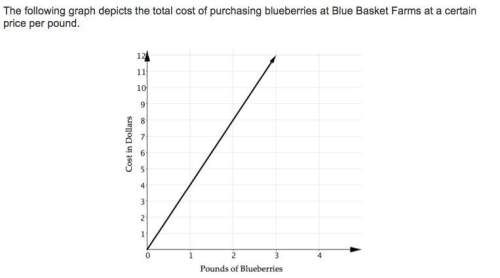
Graph is Linear, Continuous function and each pound of blueberries costs $4.
Step-by-step explanation:
This is shown per the definition of a linear graph: a line that is a straight. Its a continuous function because the pounds rise with the cost continuously, with no change in slope. Its $4 because for every pound, the cost goes up by 4. Ex. 1 pd = $4, 2 pd = $8 etc.
Abiologist is recording the loss of fish in a pond. he notes the number of fish, f, in the pond on june 1. on july 1 there were 63 fish in the pond, which is 52 fewer fish than were in the pond on june 1. which equation represents this situation? a. f – 52 = 63 b. f – 63 = 52 c. 63 – f = 52 d. f – 63 = –52
Merrida uses a pattern in the multiplication table below to find ratios that are equivalent to 7: 9. if merrida multiplies the first term, 7, by a factor of 6, what should she do to find the other term for the equivalent ratio? multiply 9 by 1. multiply 9 by 6. multiply 9 by 7. multiply 9 by 9.
Which of the following are arithmetic sequences? check all that apply. a. 0.3, 0.6, 0.9, 1.2, 1.5, b. 2, 3, 6, 11, 18, c. 150, 147, 144, 142, d. 2, 4, 9, 16, 25,