
Mathematics, 20.09.2019 20:00 yair7
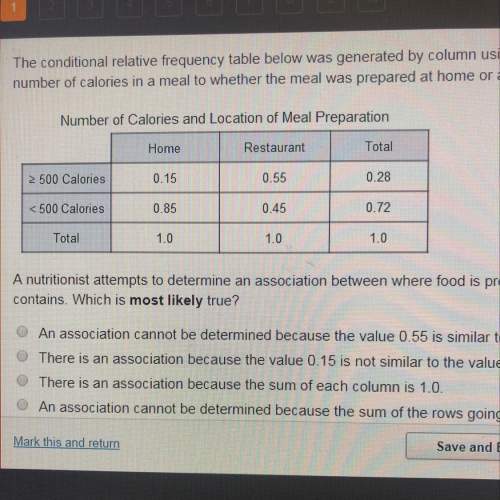
The conditional relative frequency table below was generated by column using frequency table data comparing the number of calories in a meal to whether the meal was prepared at home or at a restaurant.
a nutritionist attempts to determine an association between where food is prepared and the number of calories the food contains. which is most likely true?
a. an association cannot be determine because the value 0.55 is similar to the value 0.45
b. there is an association because the value 0.15 is not similar to the value 0.55
c. there is an association because the sum of each column is 1.0.
d. an association cannot ve determined because the sum of the rows going across is not 1.0.

Answers: 2


Other questions on the subject: Mathematics
Mathematics, 22.06.2019 00:20, mya1318
Match the following reasons with the statements given to create the proof. 1. do = ob, ao = oc sas 2. doc = aob given 3. triangle cod congruent to triangle aob vertical angles are equal. 4. 1 = 2, ab = dc if two sides = and ||, then a parallelogram. 5. ab||dc if alternate interior angles =, then lines parallel. 6. abcd is a parallelogram cpcte
Answers: 2
You know the right answer?
The conditional relative frequency table below was generated by column using frequency table data co...
Questions in other subjects:
Mathematics, 16.04.2020 22:07


Biology, 16.04.2020 22:07


