Plz
the table and the graph below each show a different relationship between the same tw...

Mathematics, 28.01.2020 12:31 mikailah0988
Plz
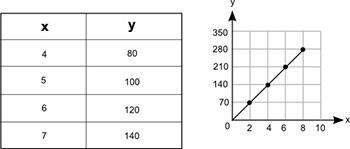
the table and the graph below each show a different relationship between the same two variables, x and y:
how much more would the value of y be on the graph than its value in the table when x = 12?
20
90
150
180

Answers: 1


Other questions on the subject: Mathematics
Mathematics, 21.06.2019 20:30, dominaricann2451
When you have 25 numbers, and jake picks 3 random numbers and puts them back, what is the chance bob has of picking those 3 numbers when he picks 6 random numbers (without putting them back)? explain.
Answers: 1
Mathematics, 22.06.2019 01:30, destiny2521
What is the domain of the of the exponential function shown below?
Answers: 2
Mathematics, 22.06.2019 04:00, chelsiem25
The function below is written in vertex form or intercept form. rewrite them in standard form and show your work. y = 5(x+3)^2-4
Answers: 2
You know the right answer?
Questions in other subjects:


Biology, 06.12.2021 04:00
Mathematics, 06.12.2021 04:00
Biology, 06.12.2021 04:00
English, 06.12.2021 04:00


