
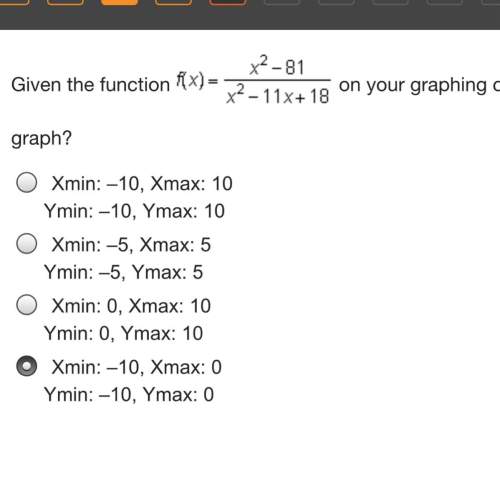
Mathematics, 29.01.2020 08:59 cheyenneisaboss22
The table shows the mean daily temperature in idaho during a week in january. which statement about the data is true?
math item stem image
the lowest mean temperature was on tuesday.
the lowest mean temperature was on thursday.
the highest mean temperature was on sunday.
the highest mean temperature was on tuesday.


Answers: 3


Other questions on the subject: Mathematics
Mathematics, 21.06.2019 14:00, Taylor73836
6.(q^9)^2 a. 2q^18 b. q^18 c. q^81 d. q^11 7.(6q^6)^-4 a. 6q^1296 b. 1296q^2 c. 1/1296q^24 d. 6q^-24 8. what is the value of 12x^-3 y^-1 for x = -1 and y = 5? a. -12/5 b.-10 c.-0 d.5/12
Answers: 1
Mathematics, 21.06.2019 16:30, chintiffany4779
The perimeter of a triangle is 69 cm. the first is 5 cm shorter than the second side. the third side is twice as long the first side. find the length of each side
Answers: 1
Mathematics, 21.06.2019 17:50, farhan61
(01.02 lc) angle abc has point e on ray ba and point d on ray bc. points e and d are equidistant from point b. to bisect angle abc, which of the following needs to be identified for the construction? the distance between points e and d the point in the angle that is equidistant from points e and d the endpoint of rays ba and bc the point outside of the angle that is equidistant from points e and d
Answers: 1
You know the right answer?
The table shows the mean daily temperature in idaho during a week in january. which statement about...
Questions in other subjects:
Mathematics, 24.09.2021 14:00

History, 24.09.2021 14:00
Mathematics, 24.09.2021 14:00
Mathematics, 24.09.2021 14:00
Mathematics, 24.09.2021 14:00

Mathematics, 24.09.2021 14:00


