 .
.

Which linear inequality is represented by the graph?
1. y > 2/3x -2
2. y <...

Mathematics, 13.11.2019 07:31 kolibeilfuss
Which linear inequality is represented by the graph?
1. y > 2/3x -2
2. y < 2/3x +2
3. y > 2/3x +1
4. y < 2/3x -1
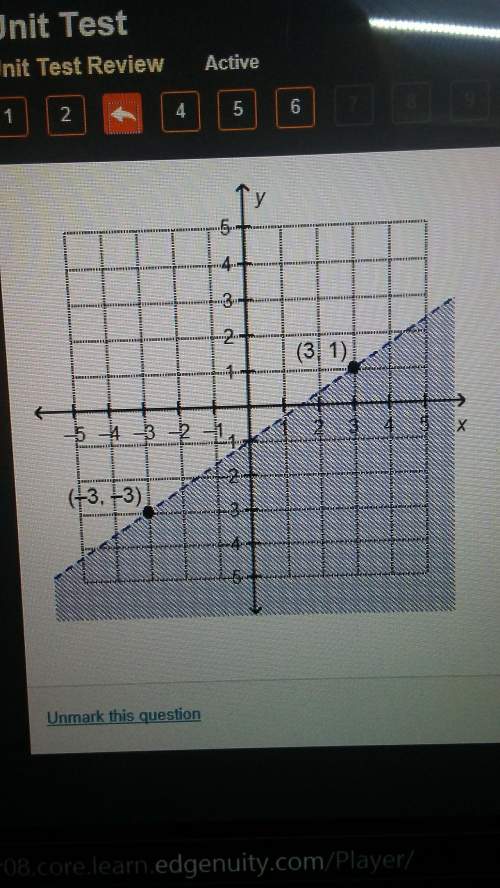

Answers: 3


Other questions on the subject: Mathematics
Mathematics, 21.06.2019 17:20, organicmemez
Researchers were interested in whether relaxation training decreases the number of headaches a person experiences. they randomly assigned 20 participants to a control group or a relaxation training group and noted the change in number of headaches each group reported from the week before training to the week after training. which statistical analysis should be performed to answer the researchers' question?
Answers: 2
Mathematics, 21.06.2019 23:30, alexandramendez0616
Hich equation can pair with x + 2y = 5 to create an inconsistent system? 2x + 4y = 3 5x + 2y = 3 6x + 12y = 30 3x + 4y = 8
Answers: 3
Mathematics, 22.06.2019 00:00, lasardia
At a pizza shop 70% of the customers order a pizza 25% of the customers order a salad and 15% of the customers order both a pizza and a salad if s customer is chosen at random what is the probability that he or she orders either a pizza or a salad
Answers: 1
You know the right answer?
Questions in other subjects:


Mathematics, 24.02.2020 23:27


