
Mathematics, 04.02.2020 15:58 NetherisIsTheQueen
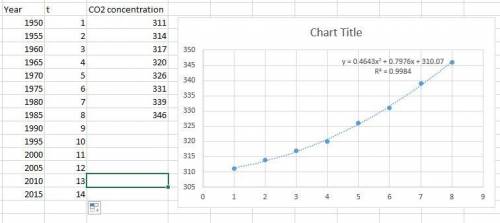
This list shows concentrations of carbon dioxide (in parts per million) in the earth's atmosphere for the years 1950, 1955, 1960, 1965, 1970, 1975, 1980, and 1985. find the mathematical model that best fits the data, and use it to predict the global mean temperature in 2015. code 1950 as 1, 1955 as 2, and so on, in five-year segments.
311 314 317 320 326 331 339 346
a. linear model; 373
b. quadratic model; 412
c. exponential model; 374
d. power model; 346

Answers: 3


Other questions on the subject: Mathematics
Mathematics, 22.06.2019 02:00, matius0711
Pleasseee important quick note: enter your answer and show all the steps that you use to solve this problem in the space provided. use the circle graph shown below to answer the question. a pie chart labeled favorite sports to watch is divided into three portions. football represents 42 percent, baseball represents 33 percent, and soccer represents 25 percent. if 210 people said football was their favorite sport to watch, how many people were surveyed?
Answers: 2
Mathematics, 22.06.2019 05:30, emmapaschen
What is the explicit formula for this sequence -7, -4, -1, 2, 5
Answers: 1
You know the right answer?
This list shows concentrations of carbon dioxide (in parts per million) in the earth's atmosphere fo...
Questions in other subjects:


Arts, 17.04.2021 20:10

Biology, 17.04.2021 20:10

English, 17.04.2021 20:10
Arts, 17.04.2021 20:10

Chemistry, 17.04.2021 20:10


