
Mathematics, 12.10.2019 04:00 ladybugys
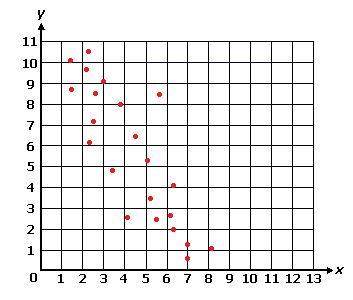
Which of the following best describes the relationship between the variables on the scatter plot below?
a. negative correlation
b. no correlation
c. positive correlation
d. positive and negative correlation

Answers: 2


Other questions on the subject: Mathematics
Mathematics, 21.06.2019 15:00, gustavoroggero39
The lee family bought their home for $220,000 this year. the equation =220,000(1.038) v = 220 , 000 ( 1 . 038 ) x can be used to find the value, v, of their home after x years. which will be the value of the lee family's home in 5 years?
Answers: 1
Mathematics, 21.06.2019 21:00, trinitymarielouis
How do you write y-10=2 (x-8) in standard form
Answers: 1
Mathematics, 22.06.2019 01:50, issagirl05
Our star pitcher, foster enlight, can throw a pitch so fast that it gets to the catcher’s mitt before it leaves foster’s fingers! if the team wins a game then the probability that foster was pitching is 0.8 but only if foster had at least one day’s rest since his last pitching assignment. if foster does not have a day off and the team still wins, the probability that foster was pitching drops by half of what it was on the previous day. if the team wins three games in succession from the toronto tachyons and foster pitched in game #2, what is the probability that he pitched in one or more of the other games? (assume that foster did not pitch on the day before the first game of this three game series.)
Answers: 1
You know the right answer?
Which of the following best describes the relationship between the variables on the scatter plot bel...
Questions in other subjects:
Mathematics, 09.10.2019 10:30


Mathematics, 09.10.2019 10:30

Chemistry, 09.10.2019 10:30


