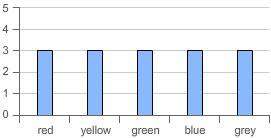
Which probability distribution table reflects the data shown in the bar graph?
(graph at the...

Mathematics, 28.01.2020 17:53 Jerrikasmith28
Which probability distribution table reflects the data shown in the bar graph?
(graph at the bottom)
x p
red 0.3
yellow 0.3
green 0.3
blue 0.3
grey 0.3
x p
red 0.1
yellow 0.2
green 0.3
blue 0.4
grey 0.5
x p
red 0.2
yellow 0.2
green 0.2
blue 0.2
grey 0.2
x p
red 0.5
yellow 0.4
green 0.3
blue 0.2
grey 0.1

Answers: 1


Other questions on the subject: Mathematics
Mathematics, 21.06.2019 14:30, logan541972
Factor. 8x2y2 – 4x2y – 12xy 4(8x2y2 – x – 12xy) 4(2xy – 4x2y – 12xy) 4x2y2(2xy – xy –3) 4xy(2xy – x – 3)
Answers: 2
You know the right answer?
Questions in other subjects:


Mathematics, 12.08.2020 07:01


