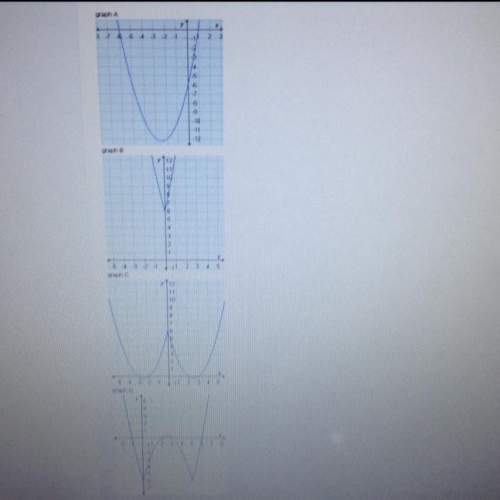
Which graph is defined by f(x)=-5|x|-6
a. graph a
b. graph b
c....

Mathematics, 26.12.2019 01:31 lisilyn2437
Which graph is defined by f(x)=-5|x|-6
a. graph a
b. graph b
c. graph c
d. graph d
srry if u can't see graph d.

Answers: 2


Other questions on the subject: Mathematics
Mathematics, 21.06.2019 17:00, danjan9084
Aplane flies around trip to philadelphia it flies to philadelphia at 220 miles per hour and back home with a tailwind at 280 miles per hour if the total trip takes 6.5 hours how many miles does the plane fly round trip
Answers: 1
Mathematics, 21.06.2019 21:30, fheight01
Name and describe the three most important measures of central tendency. choose the correct answer below. a. the mean, sample size, and mode are the most important measures of central tendency. the mean of a data set is the sum of the observations divided by the middle value in its ordered list. the sample size of a data set is the number of observations. the mode of a data set is its highest value in its ordered list. b. the sample size, median, and mode are the most important measures of central tendency. the sample size of a data set is the difference between the highest value and lowest value in its ordered list. the median of a data set is its most frequently occurring value. the mode of a data set is sum of the observations divided by the number of observations. c. the mean, median, and mode are the most important measures of central tendency. the mean of a data set is the product of the observations divided by the number of observations. the median of a data set is the lowest value in its ordered list. the mode of a data set is its least frequently occurring value. d. the mean, median, and mode are the most important measures of central tendency. the mean of a data set is its arithmetic average. the median of a data set is the middle value in its ordered list. the mode of a data set is its most frequently occurring value.
Answers: 3
Mathematics, 21.06.2019 22:00, prishnasharma34
The two box p digram the two box plots show the data of the pitches thrown by two pitchers throughout the season. which statement is correct? check all that apply. pitcher 1 has a symmetric data set. pitcher 1 does not have a symmetric data set. pitcher 2 has a symmetric data set. pitcher 2 does not have a symmetric data set. pitcher 2 has the greater variation. ots represent the total number of touchdowns two quarterbacks threw in 10 seasons of play
Answers: 1
You know the right answer?
Questions in other subjects:

Social Studies, 11.12.2020 04:30

History, 11.12.2020 04:30
Mathematics, 11.12.2020 04:30


Computers and Technology, 11.12.2020 04:30


