


raul created a graph to show the number of pages he read over a period of time.
raul cla...

Mathematics, 19.10.2019 10:50 aj0914
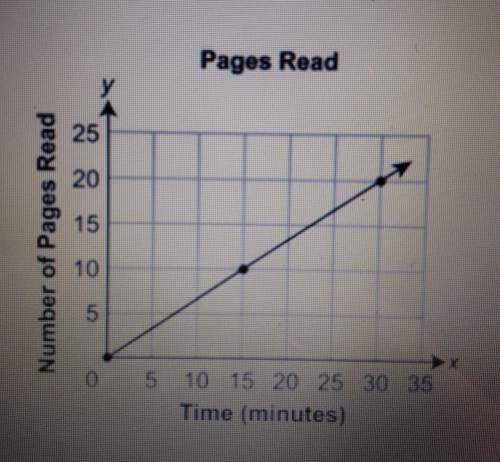
raul created a graph to show the number of pages he read over a period of time.
raul claims his graph shows a proportional relationship because the data forms a straight line.
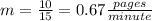
he also claims his graph shows he read 1.5 pages per minute.
are rauls claims correct? justify your reasoning.
write an equation to represent the data in the graph.

Answers: 1


Other questions on the subject: Mathematics
Mathematics, 21.06.2019 19:30, ruddymorales1123
If y varies directly as x2 and y=6 when x=6, find the constant of variation.
Answers: 2
Mathematics, 21.06.2019 22:00, JNH16
The numbers on a football field indicate 10 yard increments. you walk around the perimeter of a football field between the pylons. you walk a distance of 30623 yards. find the area and perimeter of the indicated regions. write your answers as mixed numbers, if necessary. a. one end zone: perimeter: yd area: yd2 b. the playing field (not including end zones): perimeter: yd area: yd2 c. the playing field (including end zones): perimeter: yd area: yd2
Answers: 1
Mathematics, 21.06.2019 23:00, noahdwilke
36x2 + 49y2 = 1,764 the foci are located at: (-√13, 0) and (√13,0) (0, -√13) and (0,√13) (-1, 0) and (1, 0)edit: the answer is (- the square root of 13, 0) and (the square root of 13, 0)
Answers: 1
You know the right answer?
Questions in other subjects:
Mathematics, 25.10.2020 02:40

Mathematics, 25.10.2020 02:40


Geography, 25.10.2020 02:40
Mathematics, 25.10.2020 02:40


