
Mathematics, 24.09.2019 21:30 atran4820
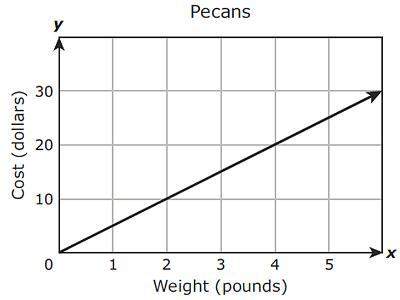
The graph above shows the relationship between the cost of some pecans and the weight of the pecans in pounds.
which function best represents the relationship shown in the graph?
a) y = 5x
b) y = 1/5x
c) y = 2x
d) y = 1/2x

Answers: 1


Other questions on the subject: Mathematics
Mathematics, 21.06.2019 17:00, danjan9084
Aplane flies around trip to philadelphia it flies to philadelphia at 220 miles per hour and back home with a tailwind at 280 miles per hour if the total trip takes 6.5 hours how many miles does the plane fly round trip
Answers: 1
Mathematics, 21.06.2019 17:00, nataliahenderso
Acylinder and its dimensions are shown. which equation can be used to find v, the volume of the cylinder in cubic centimeters?
Answers: 3
Mathematics, 21.06.2019 19:30, morganamandro9437
[15 points]find the quotient with the restrictions. (x^2 - 2x - 3) (x^2 + 4x + 3) ÷ (x^2 + 2x - 8) (x^2 + 6x + 8)
Answers: 1
Mathematics, 21.06.2019 23:00, grettelyesenia
Find the dimensions of the circle. area = 64π in.² r= in.
Answers: 1
You know the right answer?
The graph above shows the relationship between the cost of some pecans and the weight of the pecans...
Questions in other subjects:

Biology, 31.01.2020 16:50

Chemistry, 31.01.2020 16:50


English, 31.01.2020 16:50
Mathematics, 31.01.2020 16:50

Social Studies, 31.01.2020 16:50
History, 31.01.2020 16:50


