Which graph represents the solution to the system of inequalities?
x+y_< 50
x>...

Mathematics, 03.02.2020 05:04 saintsfan2004
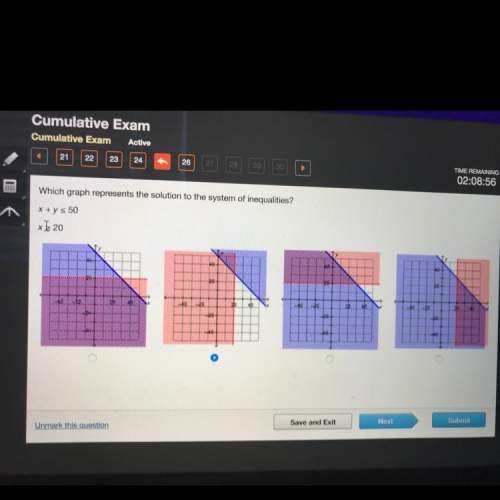
Which graph represents the solution to the system of inequalities?
x+y_< 50
x> _ 20
pls

Answers: 2


Other questions on the subject: Mathematics
Mathematics, 21.06.2019 13:20, marissasusievalles
Hello i need some with trigonometric substitutions. [tex]\int\limits^a_b {x} \, dx[/tex]
Answers: 3
Mathematics, 21.06.2019 13:40, piggygirl211
Vip at (-2,7) dropped her pass and moved to the right on a slope of -9 where can you catch up to her to return her vip pass
Answers: 1
Mathematics, 21.06.2019 17:00, softball2895
The center of a circle represent by the equation (x+9)^2+(y-6)^2=10^2 (-9,6), (-6,9), (6,-9) ,(9,-6)
Answers: 1
Mathematics, 21.06.2019 18:30, zovav1oszg9z
Analyze the graph of the cube root function shown on the right to determine the transformations of the parent function. then, determine the values of a, h, and k in the general equation.
Answers: 1
You know the right answer?
Questions in other subjects:
Mathematics, 15.04.2021 22:50

Mathematics, 15.04.2021 22:50
Mathematics, 15.04.2021 22:50

Biology, 15.04.2021 22:50


