a. f(x) = x(x − 1)(x + 1)

Mathematics, 26.09.2019 23:40 shermaine17
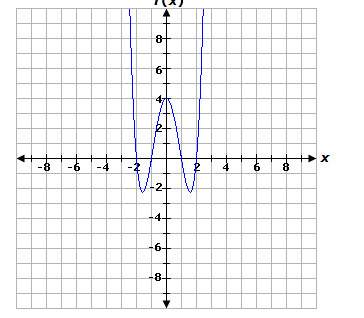
Which of the given functions could this graph represent?
a. f(x) = x(x − 1)(x + 1)
b. f(x) = (x − 1)(x − 2)(x + 1)(x + 2)
c. f(x) = x(x − 1)(x − 2)(x + 1)(x + 2)
d. f(x) = x(x − 1)(x − 2)

Answers: 2


Other questions on the subject: Mathematics
Mathematics, 21.06.2019 20:20, leximae2186
Consider the following estimates from the early 2010s of shares of income to each group. country poorest 40% next 30% richest 30% bolivia 10 25 65 chile 10 20 70 uruguay 20 30 50 1.) using the 4-point curved line drawing tool, plot the lorenz curve for bolivia. properly label your curve. 2.) using the 4-point curved line drawing tool, plot the lorenz curve for uruguay. properly label your curve.
Answers: 2
Mathematics, 21.06.2019 22:00, nancysue1975
How many ordered pairs of positive integers satisfy xy=32?
Answers: 1
Mathematics, 21.06.2019 23:10, toricepeda82
In which quadrant does the point lie? write the coordinates of the point. a. quadrant ii; (–2, –4) b. quadrant iii; (2, 4) c. quadrant iii; (–2, –4) d. quadrant iv; (–4, –2)
Answers: 3
You know the right answer?
Which of the given functions could this graph represent?
a. f(x) = x(x − 1)(x + 1)
a. f(x) = x(x − 1)(x + 1)
Questions in other subjects:

English, 20.01.2021 21:40
Mathematics, 20.01.2021 21:40

Spanish, 20.01.2021 21:40
Mathematics, 20.01.2021 21:40
Mathematics, 20.01.2021 21:40
English, 20.01.2021 21:40

English, 20.01.2021 21:40


