


Which equation does the graph below represent? (1 point)
a coordinate grid is shown. th...

Mathematics, 30.01.2020 01:04 bettylou12504
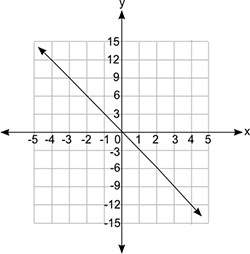
Which equation does the graph below represent? (1 point)
a coordinate grid is shown. the x-axis values are from negative 5 to positive 5 in increments of 1 for each grid line, and the y-axis values are from negative 15 to positive 15 in increments of 3 for each grid line. a line is shown passing through the ordered pairs negative 4, 12 and 0, 0 and 4, negative 12.
y = fraction negative 1 over 3x
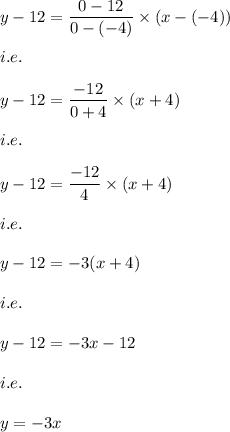
y = −3x
y = 3x
y = fraction 1 over 3x

Answers: 3


Other questions on the subject: Mathematics
Mathematics, 21.06.2019 13:00, ashleyprescot05
What is the most accurate measurement of 1 pound
Answers: 1
Mathematics, 21.06.2019 17:40, ayoismeisalex
Which number produces a rationale number when multiplied by 1/5
Answers: 1
You know the right answer?
Questions in other subjects:
Mathematics, 10.11.2020 19:00

English, 10.11.2020 19:00

History, 10.11.2020 19:00
Mathematics, 10.11.2020 19:00


Health, 10.11.2020 19:00


