
Mathematics, 18.10.2019 18:00 reticentrobbie
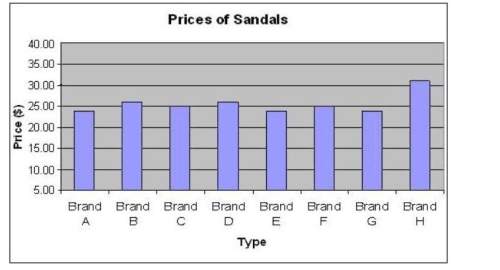
The graph shows the prices of different brands of sandals. is this graph misleading? why or why not?
a
the scale on the vertical axis goes from $0 to $40 with a regular $5 interval. the difference in the bars is not exaggerated. therefore, the graph is not misleading.
b
the scale on the vertical axis goes from $0 to $40. the interval used on the vertical axis exaggerates the differences between the bars. therefore, the graph is misleading.
c
the scale on the vertical axis goes from $5 to $40 with a regular $5 interval. even though the vertical axis does not start at 0, the difference in the bars is not exaggerated. therefore, the graph is not misleading.
d
the scale on the vertical axis goes from $5 to $40. this scale, along with the irregular interval used on the vertical axis, exaggerates the differences between the bars. therefore, the graph is misleading.

Answers: 3


Other questions on the subject: Mathematics
Mathematics, 21.06.2019 14:30, ultimateapes
Use the radius you found in part i (r=26.8 cm) with the surface area formula below to find the surface area of the sphere. show your work and round your answer to the nearest tenth. the surface area of a sphere: sa = 4πr^2 self note: 3.8.4
Answers: 2
Mathematics, 21.06.2019 19:00, garciagang0630
[15 points, algebra 2]simplify the complex fraction and find the restrictions.
Answers: 1
Mathematics, 22.06.2019 01:30, roxygirl8914
Identify all the cases where non-probability sampling is used when attempting to study the characteristics of a large city. studies on every subject in the population divide a population in groups and obtain a sample studies with a limited amount of time demonstrate existing traits in a population studies with the nth person selected
Answers: 2
You know the right answer?
The graph shows the prices of different brands of sandals. is this graph misleading? why or why not...
Questions in other subjects:

Mathematics, 24.08.2021 18:10

Biology, 24.08.2021 18:10
Mathematics, 24.08.2021 18:10


