
Mathematics, 24.11.2019 14:31 youngsunc02
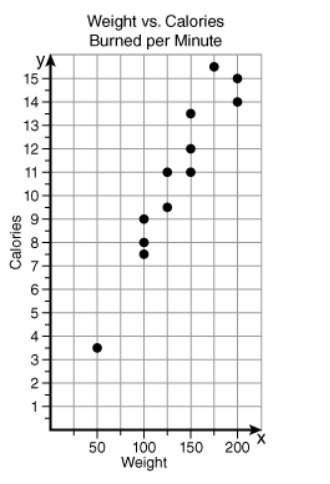
The following scatter plot represents the relationship between a person's weight and the number of calories the person burns in one minute of jump roping. what type of relationship is shown?
positive correlation
negative correlation
no correlation

Answers: 3


Other questions on the subject: Mathematics
Mathematics, 20.06.2019 18:02, joseperez1224
Atrail mix recipe includes granola oats and almonds there are 135 calories in a 1/= cup serving of the trail mix .how many calories are in2 cups of trail mix?
Answers: 1
Mathematics, 21.06.2019 16:30, danielmurillo28
If c(x) = 4x – 2 and d(x) = x2 + 5x, what is (cxd)(x)
Answers: 2
You know the right answer?
The following scatter plot represents the relationship between a person's weight and the number of c...
Questions in other subjects:
Mathematics, 17.04.2020 18:22


History, 17.04.2020 18:22


