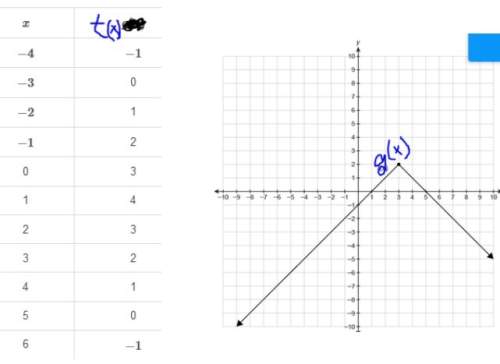
The table of values represents the function t(x) and the graph shows the function g(x).
which...

Mathematics, 25.09.2019 12:00 sameh0425
The table of values represents the function t(x) and the graph shows the function g(x).
which statement is true?
the table has fewer x-intercepts than the graph.
both functions have the same y-intercept.
the graph g(x) has a greater y-intercept compared to the table t(x).
the maximum value of the table t(x) has a greater maximum value that the graph g(x).

Answers: 1


Other questions on the subject: Mathematics
Mathematics, 21.06.2019 16:20, whitewesley124
Plot the points (0,6), (3,15.8), and (9.5,0) using the graphing tool, and find the function
Answers: 2
Mathematics, 21.06.2019 18:30, Kelseyyleigh2611
Haruka hiked several kilometers in the morning. she hiked only 66 kilometers in the afternoon, which was 25% less than she had hiked in the morning. how many kilometers did haruka hike in all?
Answers: 3
Mathematics, 21.06.2019 20:30, janeou17xn
Peter applied to an accounting firm and a consulting firm. he knows that 30% of similarly qualified applicants receive job offers from the accounting firm, while only 20% of similarly qualified applicants receive job offers from the consulting firm. assume that receiving an offer from one firm is independent of receiving an offer from the other. what is the probability that both firms offer peter a job?
Answers: 1
You know the right answer?
Questions in other subjects:


