Pls hurry! i will give
xavier created a scatterplot and a trend line for data that he collec...

Mathematics, 20.09.2019 07:00 rosehayden21
Pls hurry! i will give
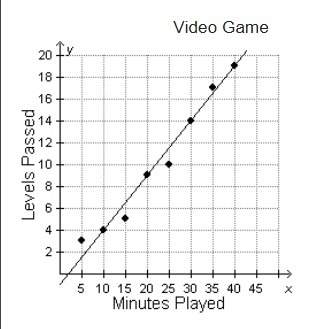
xavier created a scatterplot and a trend line for data that he collected by comparing the number of minutes he spent playing a game and the number of levels he passed.
according to the graph, which combination of minutes played and levels passed seem most likely to be possible?
a) 2 minutes played and 3 levels passed
b) 17 minutes played and 35 levels passed
c) 20 minutes played and 9 levels passed
d) 50 minutes played and 19 levels passed

Answers: 2


Other questions on the subject: Mathematics
Mathematics, 21.06.2019 22:30, alvaradorosana05
Shannon drove for 540 minutes. if she traveled 65 miles per hour, how many total miles did she travel?
Answers: 2
Mathematics, 21.06.2019 22:40, zafarm2oxgpmx
Identify this conic section. x2 - y2 = 16 o line circle ellipse parabola hyperbola
Answers: 2
Mathematics, 22.06.2019 00:00, karinagonzale80
If 7x=9y, y/z = 7/5 , then x/z = (a) 2/7 (b) 7/9 (c) 9/5 (d) 9/7 (e) 5/9
Answers: 1
You know the right answer?
Questions in other subjects:

World Languages, 25.05.2021 21:10


Mathematics, 25.05.2021 21:10
Mathematics, 25.05.2021 21:10
Mathematics, 25.05.2021 21:10
Mathematics, 25.05.2021 21:10
Mathematics, 25.05.2021 21:10


