Mathematics, 21.06.2019 20:30 ElegantEmerald
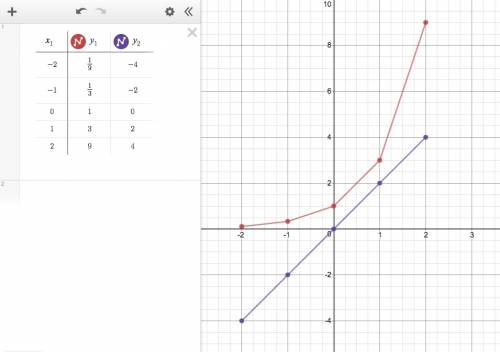
A. plot the data for the functions f(x) and g(x) on a grid and connect the points. x -2 -1 0 1 2 f(x) 1/9 1/3 1 3 9 x -2 -1 0 1 2 g(x) -4 -2 0 2 4 b. which function could be described as exponential and which as linear? explain. c. if the functions continue with the same pattern, will the function values ever be equal? if so, give estimates for the value of x that will make the function values equals. if not, explain why the function values will never be equal.

Answers: 3


Other questions on the subject: Mathematics

Mathematics, 21.06.2019 14:20, hipstersale4913
Zahra was given two data sets, one without an outlier and one with an outlier. data without an outlier: 15, 19, 22, 26, 29 data with an outlier: 15, 19, 22, 26, 29, 81
Answers: 3

Mathematics, 21.06.2019 17:30, QueenNerdy889
Suppose that an airline uses a seat width of 16.516.5 in. assume men have hip breadths that are normally distributed with a mean of 14.414.4 in. and a standard deviation of 0.90.9 in. complete parts (a) through (c) below. (a) find the probability that if an individual man is randomly selected, his hip breadth will be greater than 16.516.5 in. the probability is nothing. (round to four decimal places as needed.)
Answers: 3

Mathematics, 22.06.2019 00:50, chinyere614
Identify the statement below as either descriptive or inferential statistics. upper a certain website sold an average of 117 books per day last week. is the statement an example of descriptive or inferential statistics? a. it is an example of descriptive statistics because it uses a sample to make a claim about a population. b. it is an example of inferential statistics because it uses a sample to make a claim about a population. c. it is an example of inferential statistics because it summarizes the information in a sample. d. it is an example of descriptive statistics because it summarizes the information in a sample.
Answers: 1
You know the right answer?
A. plot the data for the functions f(x) and g(x) on a grid and connect the points. x -2 -1 0 1 2 f(x...
Questions in other subjects:


English, 03.04.2021 04:40


Mathematics, 03.04.2021 04:40

Chemistry, 03.04.2021 04:40


Mathematics, 03.04.2021 04:40


