
Mathematics, 23.06.2019 05:00 neariah24
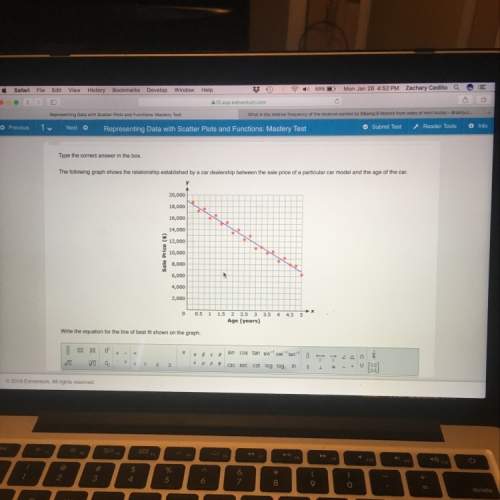
The following graph shows the relationship established by a car dealership between the sale price of a particular car model and the age of the car. y=?

Answers: 1


Other questions on the subject: Mathematics
Mathematics, 21.06.2019 22:10, ansonferns983
Given: ae ≅ ce ; de ≅ be prove: abcd is a parallelogram. we have that ab || dc. by a similar argument used to prove that △aeb ≅ △ced, we can show that △ ≅ △ceb by. so, ∠cad ≅ ∠ by cpctc. therefore, ad || bc by the converse of the theorem. since both pair of opposite sides are parallel, quadrilateral abcd is a parallelogram.
Answers: 1
Mathematics, 22.06.2019 01:30, lyndah15
Here are the 30 best lifetime baseball batting averages of all time, arranged in order from lowest to highest: 0.319, 0.329, 0.330, 0.331, 0.331, 0.333, 0.333, 0.333, 0.334, 0.334, 0.334, 0.336, 0.337, 0.338, 0.338, 0.338, 0.340, 0.340, 0.341, 0.341, 0.342, 0.342, 0.342, 0.344, 0.344, 0.345, 0.346, 0.349, 0.358, 0.366 if you were to build a histogram of these data, which of the following would be the best choice of classes?
Answers: 3
You know the right answer?
The following graph shows the relationship established by a car dealership between the sale price of...
Questions in other subjects:


Mathematics, 04.12.2020 07:00
Mathematics, 04.12.2020 07:00
Mathematics, 04.12.2020 07:00


