
Mathematics, 23.06.2019 20:00 terryhgivens5349
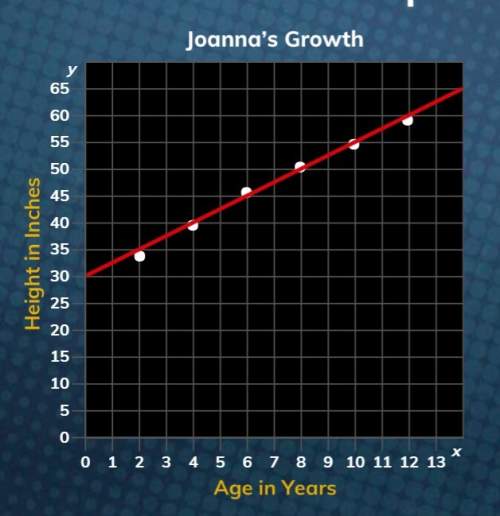
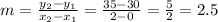
The graph below shows a scatter plot and linear model of joanna's height, in inches, for various ages. what is the best interpretation of the slope of the line? a. joanna can expect her height to increase about 2.5 inches every year. b. joanna can expect her height to increase about 2 inches every year. c. joanna can expect her height to increase about 1 inch every 2.5 years. d. joanna can expect her height to increase about 1 inch every year.

Answers: 1


Other questions on the subject: Mathematics
Mathematics, 22.06.2019 01:50, Aidanme25
If its non of them tell me..valerie took a day-trip. she drove from her house for a while and took a coffee break. after her coffee break, she continued driving. after 2 hours of driving after her coffee break, her distance from her house was 210 miles. her average speed during the whole trip was 60 miles per hour. valerie created the equation y−210=60(x−2) to represent this situation, where xx represents the time in hours from her coffee break and yy represents the distance in miles from her house. which graph correctly represents valerie's distance from her house after her coffee break?
Answers: 1
Mathematics, 22.06.2019 07:00, wwwvio7565
Atrain is travelling from new orleans to memphis at a constant spend of 79 miles per hour. new orleans and memphis are 395.1 miles apart. how long will the train be to reach memphis round to the nearest tenth
Answers: 2
Mathematics, 22.06.2019 08:30, kayleigh88
The radius of a 10 inch right circular cylinder is measured to be 4 inches, but with a possible error of ±0.1 inch. what is the resulting possible error in the volume of the cylinder? include units in your answer.
Answers: 1
You know the right answer?
The graph below shows a scatter plot and linear model of joanna's height, in inches, for various age...
Questions in other subjects:


Biology, 28.01.2020 22:53


