
Mathematics, 24.06.2019 07:30 jetblackcap
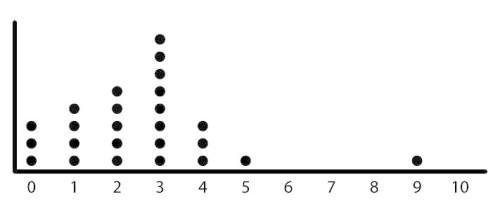
The following dot plot represents set a. 1. how many data points are in set a? 2. calculate the median and mode for this set of data. 3.calculate the range and interquartile range for this set of data. 4. visually analyze the data, using the terms cluster, gap, and outlier in your analysis. write your answer in two or more complete sentences.

Answers: 2


Other questions on the subject: Mathematics
You know the right answer?
The following dot plot represents set a. 1. how many data points are in set a? 2. calculate the me...
Questions in other subjects:

Social Studies, 13.09.2021 06:30


Mathematics, 13.09.2021 06:30

English, 13.09.2021 06:30
Mathematics, 13.09.2021 06:30


