
Mathematics, 24.06.2019 12:30 rayrayy91
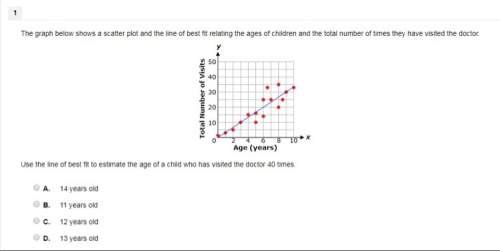
The graph shows a scatter plot and line of the best fit relating the ages of children and the total number of times they have visited the doctor. use the line of best fit to estimate the age of a child who has visited the doctor 40 times. a. 14 years old b. 11 years old c. 12 years old d. 13 years old

Answers: 3


Other questions on the subject: Mathematics
Mathematics, 21.06.2019 13:30, Angeldelissa
Which expression is factored form? x^2+14x+48 a) (x-8)(x-6) b) (x+6)(x-8) c) (x+8)(x-6) d) (x+6)(x+8)
Answers: 1
Mathematics, 21.06.2019 19:00, coryowens44
Write a fraction less than 1, which has a denominator of 6 and is greater than 3/4 plz answer !
Answers: 1
Mathematics, 21.06.2019 19:30, alanaruth3389
Consider a cube that has sides of length l. now consider putting the largest sphere you can inside this cube without any point on the sphere lying outside of the cube. the volume ratio -volume of the sphere/ volume of the cube is 1. 5.2 × 10⁻¹ 2. 3.8 × 10⁻¹ 3. 1.9 4. 2.5 × 10⁻¹ 5. 3.8
Answers: 2
Mathematics, 21.06.2019 22:30, jedsgorditas
Collin did the work to see if 10 is a solution to the equation r/4=2.4
Answers: 1
You know the right answer?
The graph shows a scatter plot and line of the best fit relating the ages of children and the total...
Questions in other subjects:

Physics, 26.03.2021 04:10
Mathematics, 26.03.2021 04:10

Arts, 26.03.2021 04:10
Mathematics, 26.03.2021 04:10


Biology, 26.03.2021 04:10


