
Mathematics, 25.06.2019 05:30 kaleahearly123
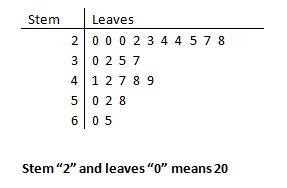
Use the data to create a stemplot. twenty-four workers were surveyed about how long it takes them to travel to work each day. the data below are given in minutes. 20 35 42 52 65 20 60 49 24 37 23 24 22 20 41 25 28 27 50 47 58 30 32 48

Answers: 1


Other questions on the subject: Mathematics
Mathematics, 21.06.2019 17:10, Andrewecolt1993
Which is a graph of a proportional relationship?
Answers: 1
Mathematics, 21.06.2019 23:00, annnoe5128abc
Asporting good store is offering 30 percent off of the original price(x) of football cleats. the discount will be reduced by an another $7 before sales tax.
Answers: 1
You know the right answer?
Use the data to create a stemplot. twenty-four workers were surveyed about how long it takes them to...
Questions in other subjects:

English, 14.09.2021 01:30


Mathematics, 14.09.2021 01:30
English, 14.09.2021 01:30


