
Mathematics, 26.06.2019 02:30 greekfreekisdbz
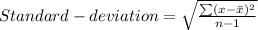
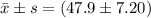
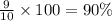
For the following data set calculate the percentage of data points that fall within one standard deviation of the mean, and compare the result to the expected percentage of a normal distribution. {50,46,54,51,29,52,48,54,47,48}

Answers: 1


Other questions on the subject: Mathematics
Mathematics, 21.06.2019 15:30, makaylapink8167
The tiles below are pieces of a normal ecg tracing representing a little less than two heartbeats at a resting rate of 80 bpm. arrange the tiles in their correct order. rank from first to last. do not overlap any tiles.
Answers: 1
Mathematics, 21.06.2019 23:00, koryhudson8124
How many heads would you expect if you flipped a coin twice? first, fill in the table below with the correct probabilities. hint: the sample space for flipping a coin twice is {hh, ht, th, tt}. a = b = c = f
Answers: 1
Mathematics, 22.06.2019 00:20, ridzrana02
Jubal wrote the four equations below. he examined them, without solving them, to determine which equation has no solution. which of jubal’s equations has no solution hurry
Answers: 1
Mathematics, 22.06.2019 01:10, sman091305
Ofin . (2,4) (2,1) a. y= 2 b. x= 2 c. x= -2 d. y= 2x
Answers: 1
You know the right answer?
For the following data set calculate the percentage of data points that fall within one standard dev...
Questions in other subjects:
Mathematics, 17.09.2019 20:00
Mathematics, 17.09.2019 20:00


Social Studies, 17.09.2019 20:00


