
Mathematics, 27.06.2019 09:30 cyni
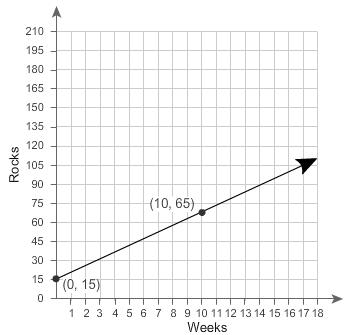
Need ! | will give ! v which situation does the graph represent? a. tom starts a rock collection. each week he adds 15 more rocks. the graph shows how many rocks tom has each week. b. tom has 5 rocks in his collection. each week he adds 15 more rocks. the graph shows how many rocks tom has each week. c. tom has 10 rocks in his collection. each week he adds 5 more rocks. the graph shows how many rocks tom has over time. d. tom has 15 rocks in his collection. each week he adds 5 more rocks. the graph shows how many rocks tom has over time.

Answers: 2


Other questions on the subject: Mathematics
Mathematics, 21.06.2019 14:00, zahriamarie10
Match each expression with its simplified form.
Answers: 1
Mathematics, 21.06.2019 18:50, millernicholas622
The random variable x represents the number of phone calls an author receives in a day, and it has a poisson distribution with a mean of 8.7 calls. what are the possible values of x
Answers: 1
Mathematics, 21.06.2019 21:30, lewisf5929
Vanessa earns a base salary of $400.00 every week with an additional5% commission on everything she sells. vanessa sold $1650.00 worth of items last week.
Answers: 2
You know the right answer?
Need ! | will give ! v which situation does the graph represent? a. tom starts a rock collectio...
Questions in other subjects:


