
Mathematics, 27.06.2019 10:00 jdkrisdaimcc11
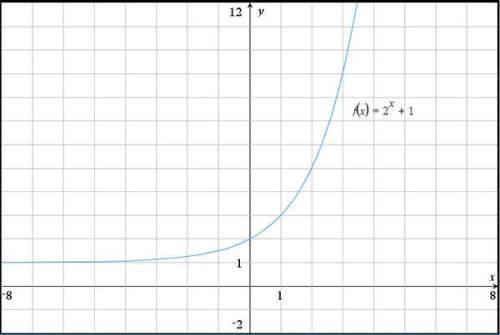
And fast i need this done asap the graph of f(x) = 2^x + 1 is shown below. explain how to find the average rate of change between x = 0 and x = 3.

Answers: 1


Other questions on the subject: Mathematics
Mathematics, 21.06.2019 20:30, daniiltemkin20
List x1, x2, x3, x4 where xi is the left endpoint of the four equal intervals used to estimate the area under the curve of f(x) between x = 4 and x = 6. a 4, 4.5, 5, 5.5 b 4.5, 5, 5.5, 6 c 4.25, 4.75, 5.25, 5.75 d 4, 4.2, 5.4, 6
Answers: 1
Mathematics, 22.06.2019 00:30, ERIKALYNN092502
The scatter plot shows the number of animal cells clara examined in a laboratory in different months: plot ordered pairs 1, 20 and 2, 60 and 3,100 and 4, 140 and 5, 180 what is the approximate predicted number of animal cells clara examined in the 9th month?
Answers: 3
You know the right answer?
And fast i need this done asap the graph of f(x) = 2^x + 1 is shown below. explain how to find the a...
Questions in other subjects:

Biology, 11.03.2020 16:30


Physics, 11.03.2020 16:32
Mathematics, 11.03.2020 16:32

Mathematics, 11.03.2020 16:32


