
Mathematics, 27.06.2019 12:30 jadejordan8888
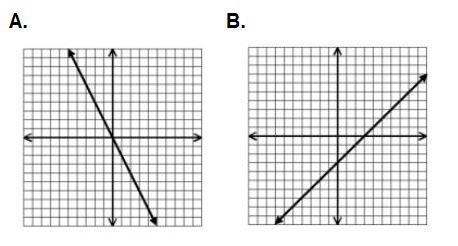
20 ! ! which statement is true about the graphs shown? a) only graph a represents a proportional relationship. b) only graph b represents a proportional relationship. c) graph a and graph b both represent a proportional relationship. d) graph a and graph b both represent a non-proportional relationship.

Answers: 1
 or
or 


Other questions on the subject: Mathematics
Mathematics, 21.06.2019 14:30, ultimateapes
Use the radius you found in part i (r=26.8 cm) with the surface area formula below to find the surface area of the sphere. show your work and round your answer to the nearest tenth. the surface area of a sphere: sa = 4πr^2 self note: 3.8.4
Answers: 2
Mathematics, 21.06.2019 17:00, nicolemaefahey
Need this asap if anyone can i would be very grateful. if you could show workings that would really
Answers: 1
Mathematics, 21.06.2019 19:30, markel19
The position of a moving particle is given by the position function: f(t)=-9t-t^2-0.2t^3+0.1t^4 0 a. at what time does the particle reverse direction? b. when is the displacement positive? (round one decimal place and answer in interval notation) c. when is the displacement negative? (round one decimal place and answer in interval notation) d. when is the particle’s acceleration positive? (round one decimal place and answer in interval notation) e. when is the particle’s acceleration negative? (round one decimal place and answer in interval notation)
Answers: 3
You know the right answer?
20 ! ! which statement is true about the graphs shown? a) only graph a represents a proportional...
Questions in other subjects:

Biology, 16.09.2021 01:00
Mathematics, 16.09.2021 01:00


English, 16.09.2021 01:00


