

50 points plus brainliest
data plots - quiz (5/5)
@platonation
all questions 1-5...

Mathematics, 23.12.2019 11:31 keaudresp57ie1
50 points plus brainliest
data plots - quiz (5/5)
@platonation
all questions 1-5 are provided with pictures.
1. the dot plot represents the scores of a group of students on an english test. if the dot plot is converted to a box plot, the first quartile would be drawn at __1__ , and the median would be drawn at__2__ .
[1] 2,3,4,5
[2] 2,3,4,5
2. what does point a represent in this box plot?
a. the first quartile
b. the third quartile
c. the smallest value
d. the largest value
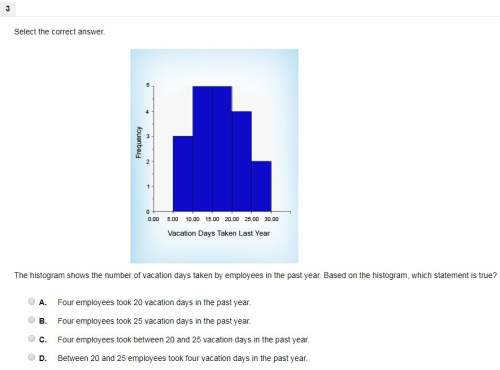
3. the histogram shows the number of vacation days taken by employees in the past year. based on the histogram, which statement is true?
a. four employees took 20 vacation days in the past year.
b. four employees took 25 vacation days in the past year.
c. four employees took between 20 and 25 vacation days in the past year.
d. between 20 and 25 employees took four vacation days in the past year.
4. match the values associated with this data set to their correct descriptions.
{6, 47, 49, 15, 43, 41, 7, 36}
38.5 / 45 / 11 / 10.5
a. first quartile
b. median
c. third quartile
d. the difference
of the largest
value and the
median
5. the data set {7, 20, 51, 6, 30, 72, 31, 84, 28, 77, 98} is to be represented by a histogram. which first interval would most clearly and simply show the distribution of this data?
a. 0–5
b. 0–10
c. 0–50
d. 0–100


Answers: 2


Other questions on the subject: Mathematics
Mathematics, 21.06.2019 13:00, nicolescaggs
There is a line with slope 1/a going through the point (a, a²). find the equation of the line perpendicular to this line at this point. (don’t let this problem intimidate you! solve the problem as you would if i’d given you specific values. just use variables instead.)
Answers: 2
Mathematics, 21.06.2019 21:30, xaguilar
Data from 2005 for various age groups show that for each $100 increase in the median weekly income for whites, the median weekly income of blacks increases by $105. also, for workers of ages 25 to 54 the median weekly income for whites was $676 and for blacks was $527. (a) let w represent the median weekly income for whites and b the median weekly income for blacks, and write the equation of the line that gives b as a linear function of w. b = (b) when the median weekly income for whites is $760, what does the equation in (a) predict for the median weekly income for blacks?
Answers: 2
Mathematics, 21.06.2019 23:40, alyxkellar06
From the top of a tree a bird looks down on a field mouse at an angle of depression of 50°. if the field mouse is 40 meters from the base of the tree, find the vertical distance from the ground to the bird's eyes.
Answers: 1
You know the right answer?
Questions in other subjects:

Biology, 03.08.2019 17:30

Social Studies, 03.08.2019 17:30

Biology, 03.08.2019 17:30

Mathematics, 03.08.2019 17:30

Advanced Placement (AP), 03.08.2019 17:30


