
Mathematics, 27.06.2019 19:30 10040816
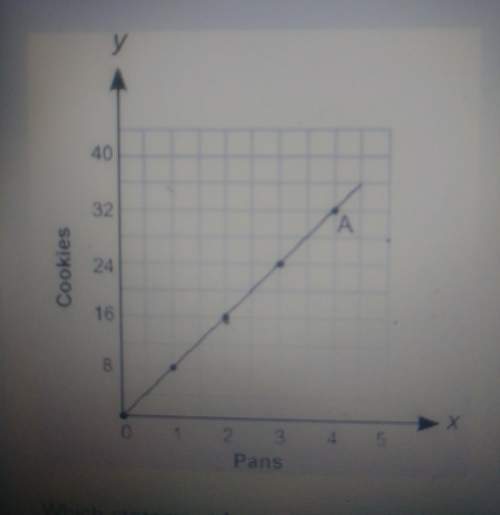
The graph below shows the relationship between the number of cookies made and the number of pans used: which statement best describes point a on the graph? a: four pans make 16 cookies b: four pans make 32 cookies c: one pan makes 16 cookies d: one pan makes 32 cookies

Answers: 2


Other questions on the subject: Mathematics
Mathematics, 21.06.2019 19:50, khenalilovespandas
Type the correct answer in each box. spell all words correctly. a sequence of transformations maps ∆abc onto ∆a″b″c″. the type of transformation that maps ∆abc onto ∆a′b′c′ is a . when ∆a′b′c′ is reflected across the line x = -2 to form ∆a″b″c″, vertex of ∆a″b″c″ will have the same coordinates as b′.
Answers: 1
Mathematics, 21.06.2019 21:30, alexialoredo625
Plz hurry evaluate the expression a+b where a=8 and b=19
Answers: 1
Mathematics, 22.06.2019 00:00, sakurauchiha913
A6 ounce bottle of dressing costs $1.56 a 14 ounce bottle costs $3.36 a 20 ounce bottle costs $5.60 which has the lowest cost per ounce
Answers: 1
You know the right answer?
The graph below shows the relationship between the number of cookies made and the number of pans use...
Questions in other subjects:

Mathematics, 06.01.2021 19:50

Mathematics, 06.01.2021 19:50
English, 06.01.2021 19:50


