
Mathematics, 01.07.2019 21:30 KnMcdonaldk93906
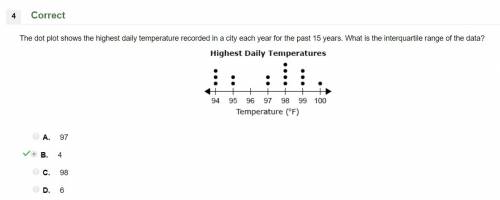
The dot plot shows the highest daily temperature recorded in a city each year for the past 15 years. what is the interquartile range of the data? a. 97 b. 4 c. 6 d. 98

Answers: 1


Other questions on the subject: Mathematics
Mathematics, 21.06.2019 18:00, jabraeshaw
Which shows the correct solution of the equation 1/2a+2/3b=50, when b=30?
Answers: 1
Mathematics, 21.06.2019 19:30, SMURFETTE86
Identify the number 127 as a rational or irrational. explain
Answers: 2
Mathematics, 21.06.2019 20:20, jackiediaz
One of every 20 customers reports poor customer service on your company’s customer satisfaction survey. you have just created a new process that should cut the number of poor customer service complaints in half. what percentage of customers would you expect to report poor service after this process is implemented? 1.) 5% 2.) 10% 3.) 2% 4.) 2.5%
Answers: 1
You know the right answer?
The dot plot shows the highest daily temperature recorded in a city each year for the past 15 years....
Questions in other subjects:

Mathematics, 06.01.2021 03:10

Arts, 06.01.2021 03:10

Mathematics, 06.01.2021 03:10
Physics, 06.01.2021 03:10


