
Mathematics, 03.07.2019 23:00 Kareemgreen1237
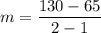
The graph shows the distance, y, that a car traveled in x hours: a graph is shown with the x-axis title as time in hours. the title on the y-axis is distance traveled in miles. the values on the x-axis are from 0 to 5 in increments of 1 for each grid line. the values on the y-axis are from 0 to 325 in increments of 65 for each grid line. a line is shown connecting ordered pairs 1, 65 and 2, 130 and 3, 195 and 4, 260. the title of the graph is rate of travel. what is the rate of change for the relationship represented in the graph? (1 point) fraction 1 over 65 fraction 1 over 64 64 65

Answers: 1


Other questions on the subject: Mathematics
Mathematics, 21.06.2019 22:30, cbkhm
Tommy buys a sweater that is on sale for 40% off the original price. the expression p -0.4p can be used to find the sale price of the sweater, where p is the original price of the sweater. if the original price of the sweater is 50, what is the sale price?
Answers: 1
Mathematics, 22.06.2019 04:00, jaylynomalley
In a fruit survey, 300 children choose their favorite fruit out of apples, bananas, and watermelon. 150 chose apples and 90 chose bananas. what percent chose watermelon?
Answers: 1
You know the right answer?
The graph shows the distance, y, that a car traveled in x hours: a graph is shown with the x-axis t...
Questions in other subjects:


History, 31.07.2019 03:00
Biology, 31.07.2019 03:00

Computers and Technology, 31.07.2019 03:00


