
Mathematics, 04.07.2019 21:30 christianconklin22
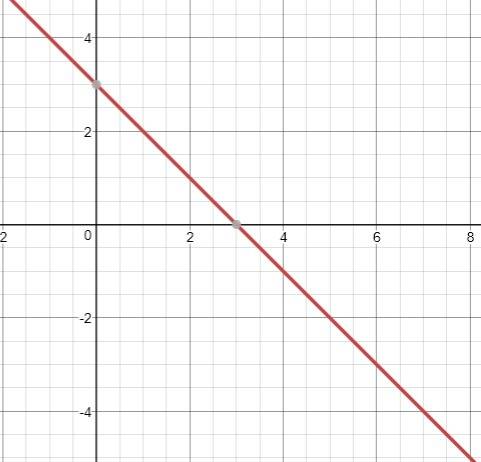
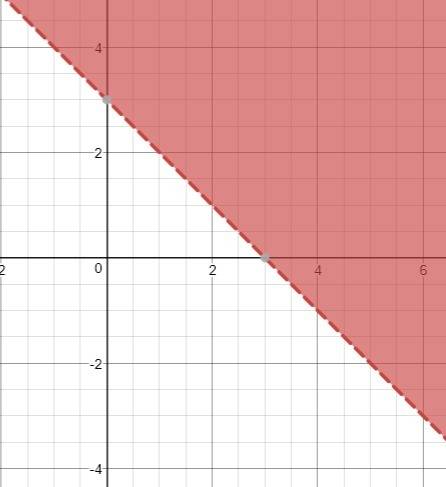
Which graph represents the inequality y> 3−x?

Answers: 1


Other questions on the subject: Mathematics
Mathematics, 21.06.2019 15:10, ineemorehelp
Can (2,3 and square root 10) be sides ona right triangle?
Answers: 1
Mathematics, 21.06.2019 15:40, xxaurorabluexx
What is the distance between the points 4,10 and -3,-14 on the coordinate plane
Answers: 2
Mathematics, 21.06.2019 18:30, veheca
According to the 2008 u. s. census, california had a population of approximately 4 × 10^7 people and florida had a population of approximately 2 × 10^7 people. which of the following is true? a. the population of florida was approximately two times the population of california. b. the population of florida was approximately twenty times the population of california. c. the population of california was approximately twenty times the population of florida. d. the population of california was approximately two times the population of florida.
Answers: 1
You know the right answer?
Which graph represents the inequality y> 3−x?...
Questions in other subjects:
Mathematics, 05.05.2020 22:43

Mathematics, 05.05.2020 22:43
Mathematics, 05.05.2020 22:43


Business, 05.05.2020 22:43


