
Mathematics, 07.07.2019 17:30 lisaboden1701
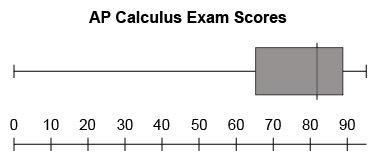
The ap calculus exam scores were released in july. the secondary math specialist prepared the box plot shown to present the scores to the superintendent. what's the range of scores that represents the middle 50 percent of the students who took the test? a. 65%–89% b. 65%–94% c. 81%–89% d. 65%–81%

Answers: 1


Other questions on the subject: Mathematics
Mathematics, 21.06.2019 18:00, evarod
The given dot plot represents the average daily temperatures, in degrees fahrenheit, recorded in a town during the first 15 days of september. if the dot plot is converted to a box plot, the first quartile would be drawn at __ , and the third quartile would be drawn at link to the chart is here
Answers: 1
Mathematics, 21.06.2019 22:10, Kurlyash
Atype of plant is introduced into an ecosystem and quickly begins to take over. a scientist counts the number of plants after mmonths and develops the equation p(m)= 19.3(1.089)^m to model the situation. most recently, the scientist counted 138 plants. assuming there are no limiting factors to the growth of the plants, about how many months have passed since the plants werefirst introduced? a)o 6.1b)0.6.6c)10 72d)o 23.1
Answers: 3
You know the right answer?
The ap calculus exam scores were released in july. the secondary math specialist prepared the box pl...
Questions in other subjects:

Chemistry, 03.06.2021 21:20
Mathematics, 03.06.2021 21:20


Biology, 03.06.2021 21:20
Mathematics, 03.06.2021 21:20

English, 03.06.2021 21:20
Mathematics, 03.06.2021 21:20


