
Mathematics, 09.07.2019 10:00 postorivofarms
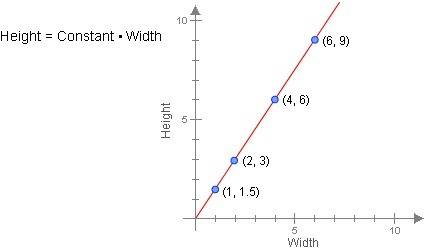
According to the graph, what is the value of the constant in the equation below?

Answers: 2
![\bf \qquad \qquad \textit{direct proportional variation} \\\\ \textit{\underline{y} varies directly with \underline{x}}\qquad \qquad y=kx\impliedby \begin{array}{llll} k=constant\ of\\ \qquad variation \end{array} \\\\[-0.35em] \rule{34em}{0.25pt}\\\\ \begin{cases} x=6\\ y=9 \end{cases}\implies 9=k6\implies \cfrac{9}{6}=k\implies \cfrac{3}{2}=k](/tpl/images/1116/4034/011d5.png)


Other questions on the subject: Mathematics
Mathematics, 21.06.2019 14:30, Thejollyhellhound20
30 points and i will give brainliest the club will base its decision about whether to increase the budget for the indoor rock climbing facility on the analysis of its usage. the decision to increase the budget will depend on whether members are using the indoor facility at least two times a week. use the best measure of center for both data sets to determine whether the club should increase the budget. assume there are four weeks in a month. if you think the data is inconclusive, explain why.
Answers: 3
Mathematics, 21.06.2019 23:00, shawdyylinda
The architect's side view drawing of a saltbox-style house shows a post that supports the roof ridge. the support post is 8 ft tall. the distance from the front of the house to the support post is less than the distance from the post to the back of the house. how far from the front of the house is the support post positioned?
Answers: 1
Mathematics, 22.06.2019 01:10, hellicuh
Evaluate 8x2 + 9x − 1 2x3 + 3x2 − 2x dx. solution since the degree of the numerator is less than the degree of the denominator, we don't need to divide. we factor the denominator as 2x3 + 3x2 − 2x = x(2x2 + 3x − 2) = x(2x − 1)(x + 2). since the denominator has three distinct linear factors, the partial fraction decomposition of the integrand has the form† 8x2 + 9x − 1 x(2x − 1)(x + 2) = correct: your answer is correct. to determine the values of a, b, and c, we multiply both sides of this equation by the product of the denominators, x(2x − 1)(x + 2), obtaining 8x2 + 9x − 1 = a correct: your answer is correct. (x + 2) + bx(x + 2) + cx(2x − 1).
Answers: 3
You know the right answer?
According to the graph, what is the value of the constant in the equation below?...
Questions in other subjects:


History, 08.03.2021 04:00

Mathematics, 08.03.2021 04:00


