
Mathematics, 10.07.2019 10:30 firenation18
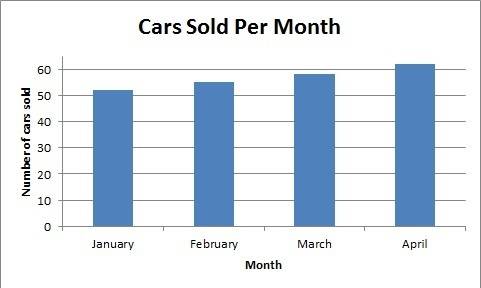
Math (use first pic for first two questions.) 1. what might the creator of this graph want the reader to conclude? ·the car dealer sold twice as many cars in april as in january. ·the car dealer sold the most cars in january. ·the car dealer's business is expanding very rapidly. ·the car dealer sold three times as many cars in march as in february. 2. what is one way to make this graph less misleading? · use wider bars for each month. · start the y-axis at 50 and use an interval of 1. ·use different colors for each month. ·start the y-axis at zero and use an interval of 5 or 10. (use second pic for this question.) 3. the camera shop wants to use the measure of central tendency that expresses how successful they are in selling cameras. which measure of central tendency should they choose? ·mean ·interquartile range ·mode ·median

Answers: 1


Other questions on the subject: Mathematics
Mathematics, 21.06.2019 17:00, Calvinailove13
An air conditioning system can circulate 350 cubic feet of air per minute. how many cubic yards of air can it circulate per minute?
Answers: 3
Mathematics, 21.06.2019 19:50, nawafcanada
On a piece of paper graft y+2> -3x-3 then determine which answer matches the graph you drew
Answers: 2
Mathematics, 21.06.2019 21:30, achsahjosey
Acyclist bike x distance at 10 miles per hour .and returns over the same path at 8 miles per hour. what is the cyclist average rate for the round trip in miles per hour ?
Answers: 1
You know the right answer?
Math (use first pic for first two questions.) 1. what might the creator of this graph want the read...
Questions in other subjects:

Mathematics, 11.03.2021 15:00


Physics, 11.03.2021 15:00
Mathematics, 11.03.2021 15:00


