
Mathematics, 12.07.2019 14:30 chloeethoma24
Which of the following represents the graph of the function f(x) = log3(x − 2)? graph begins in the third quadrant and is increasing quickly. as the graph crosses the axis at negative 1, 0, the graph does not increase as fast. the graph crosses the y axis and continues to increase slowly throughout the first quadrant. graph begins in the fourth quadrant and is increasing quickly. as the graph crosses the x axis at 3, 0, the graph does not increase as fast. the graph continues to increase slowly throughout the first quadrant. graph begins in the fourth quadrant and is increasing quickly. as the graph crosses the point 1, 2, the graph does not increase as fast. the graph continues to increase slowly throughout the first quadrant. graph begins in the fourth quadrant and is increasing quickly. as the graph crosses the point 1, negative 2, the graph does not increase as fast. the graph continues to increase slowly throughout the first quadrant.

Answers: 1
 is shown in the figure below. As you can see, the x-intercept is the point
  . The domain of this function is
  and the range is the set of all real numbers. The graph begins in the fourth quadrant and increases quickly there. Next, the graph continues to increase slowly in the first quadrant.
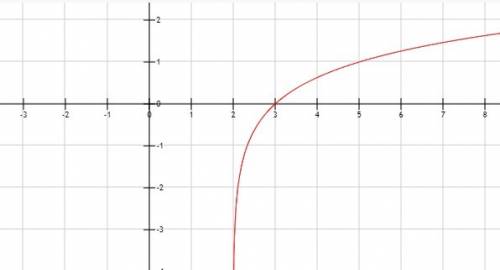


Other questions on the subject: Mathematics
Mathematics, 21.06.2019 13:30, coleman4405
Factorize: x^2+8x+10 i just solved it but i don't know if the process is correct
Answers: 3
Mathematics, 21.06.2019 19:30, maribelarreolap4sgpj
Two corresponding sides of two similar triangles are 3cm and 5cm. the area of the first triangle is 12cm^2. what is the area of the second triangle?
Answers: 1
Mathematics, 21.06.2019 21:30, lainnn974
Questions 7-8. use the following table to answer. year 2006 2007 2008 2009 2010 2011 2012 2013 cpi 201.6 207.342 215.303 214.537 218.056 224.939 229.594 232.957 7. suppose you bought a house in 2006 for $120,000. use the table above to calculate the 2013 value adjusted for inflation. (round to the nearest whole number) 8. suppose you bought a house in 2013 for $90,000. use the table above to calculate the 2006 value adjusted for inflation. (round to the nearest whole number)
Answers: 3
Mathematics, 21.06.2019 23:30, cam6877
Katie wants to collect over 100 seashells. she already has 34 seashells in her collection. each day, she finds 12 more seashells on the beach. katie can use fractions of days to find seashells. write an inequality to determine the number of days, dd, it will take katie to collect over 100 seashells.
Answers: 1
You know the right answer?
Which of the following represents the graph of the function f(x) = log3(x − 2)? graph begins in the...
Questions in other subjects:


Physics, 27.02.2020 04:12


