
Mathematics, 15.07.2019 23:00 cgarcia04
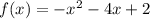
Which statements about the graph of the function f(x) = –x2 – 4x + 2 are true? check all that apply. the domain is {x|x ≤ –2}. the range is {y|y ≤ 6}. the function is increasing over the interval (–∞ , –2). the function is decreasing over the interval (−4, ∞). the function has a positive y-intercept.

Answers: 1
 is parabola with branches going down in the negative direction of y-axis.
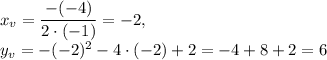
 and the maximum value of y is at the vertex, then the range is
 ![(-\infty,6]](/tpl/images/0094/1612/1c600.png) .The function is increasing for x<-2 and decreasing for x>-2 (since vertex is the maximum point).
.The function is increasing for x<-2 and decreasing for x>-2 (since vertex is the maximum point).

Other questions on the subject: Mathematics
Mathematics, 21.06.2019 15:30, groverparham3
Is each relation a function? if so, state whether it is one-to-one or many-to-one. 3. (-4,7), (-3,5), (1,4), (3,-8), (5,-11) 4. (-4,8), (-2,4), (0,1), (2,4), (4,8) 5. (-2, 1), (-2,3), (0,-3), (1,4), (3,1)
Answers: 3
Mathematics, 21.06.2019 21:30, maddie02294
Look at triangle wxy what is the length (in centimeters) of the side wy of the triangle?
Answers: 1
Mathematics, 21.06.2019 23:50, jasminechambers642
What is the probably of getting heads when poing a coin and getting a number greater than or equal to 5 when rolling a single diea) 1/6b) 1/3c) 1/4d) 1/12
Answers: 2
Mathematics, 22.06.2019 01:00, s27511583
The weight of 46 new patients of a clinic from the year 2018 are recorded and listed below. construct a frequency distribution, using 7 classes. then, draw a histogram, a frequency polygon, and an ogive for the data, using the relative information from the frequency table for each of the graphs. describe the shape of the histogram. data set: 130 192 145 97 100 122 210 132 107 95 210 128 193 208 118 196 130 178 187 240 90 126 98 194 115 212 110 225 187 133 220 218 110 104 201 120 183 124 261 270 108 160 203 210 191 180 1) complete the frequency distribution table below (add as many rows as needed): - class limits - class boundaries - midpoint - frequency - cumulative frequency 2) histogram 3) frequency polygon 4) ogive
Answers: 1
You know the right answer?
Which statements about the graph of the function f(x) = –x2 – 4x + 2 are true? check all that apply...
Questions in other subjects:
Mathematics, 31.08.2021 01:10


Social Studies, 31.08.2021 01:10

Mathematics, 31.08.2021 01:10
Mathematics, 31.08.2021 01:10
Mathematics, 31.08.2021 01:10
Mathematics, 31.08.2021 01:10


